AWS API Gateway Access Logs. How to get them and what to do with them.
- Published on
- Authors
- Name
- Binh Bui
- @bvbinh


Photo by Marek Piwnicki Boxed Water Is Better
What are API Gateway Access Logs?
API Gateway Access logs are a feature of API Gateway that allows you to log all requests made to your API. This is a great feature to have enabled for debugging purposes. You can also use this data to create metrics and dashboards to monitor your API. You can read more about API Gateway Access Logs here.
Access logs are useful for two main reasons:
- Debugging: If you get a spike in 500 Internal Server Error responses, you can locate an access log to point you in the right direction to start your investigation.
- Performance analysis: You can analyze your access logs to look for performance degradations over time or to identify slow endpoints.
While API Gateway Access Logs are a great feature, they are not enabled by default. You will need to enable them in order to start logging requests.
Access logs vs. execution logs
There are two types of API logging in CloudWatch: execution logging and access logging.
- Execution logging: This is the default logging that is enabled for all API Gateway APIs. It logs the execution of your API. This includes the request, response, and any errors that occur during the execution of your API. You can read more about execution logging here.
- Access logging: This is a feature that you can enable to log all requests made to your API. You can read more about access logging here.
In the API Gateway console, you can configure them in the following screen:

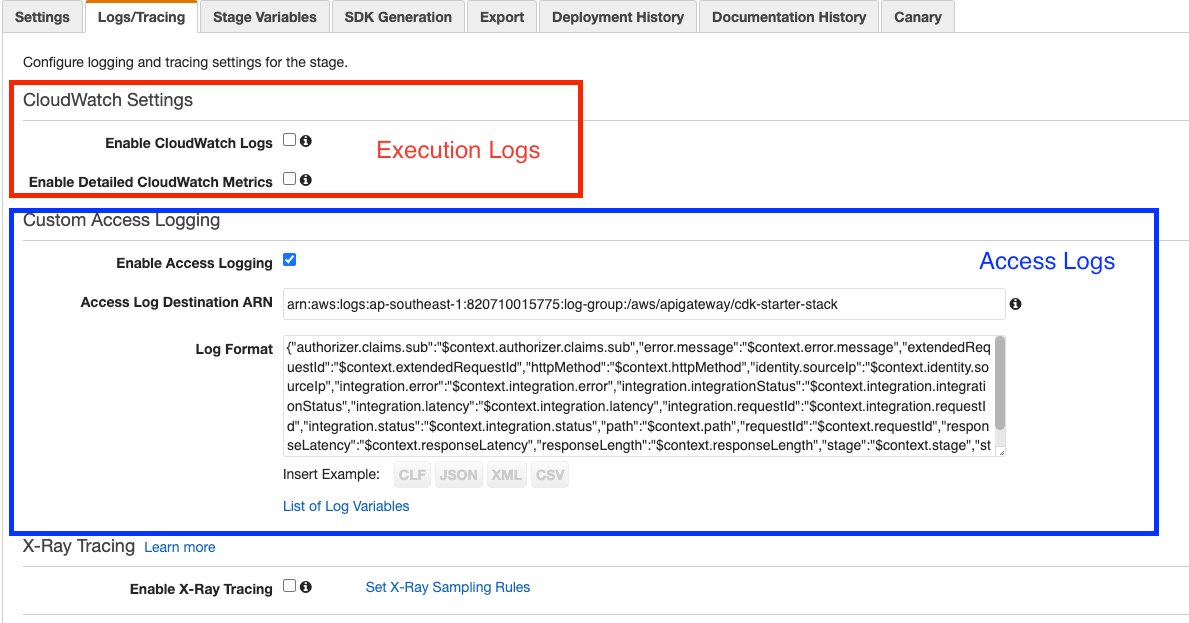
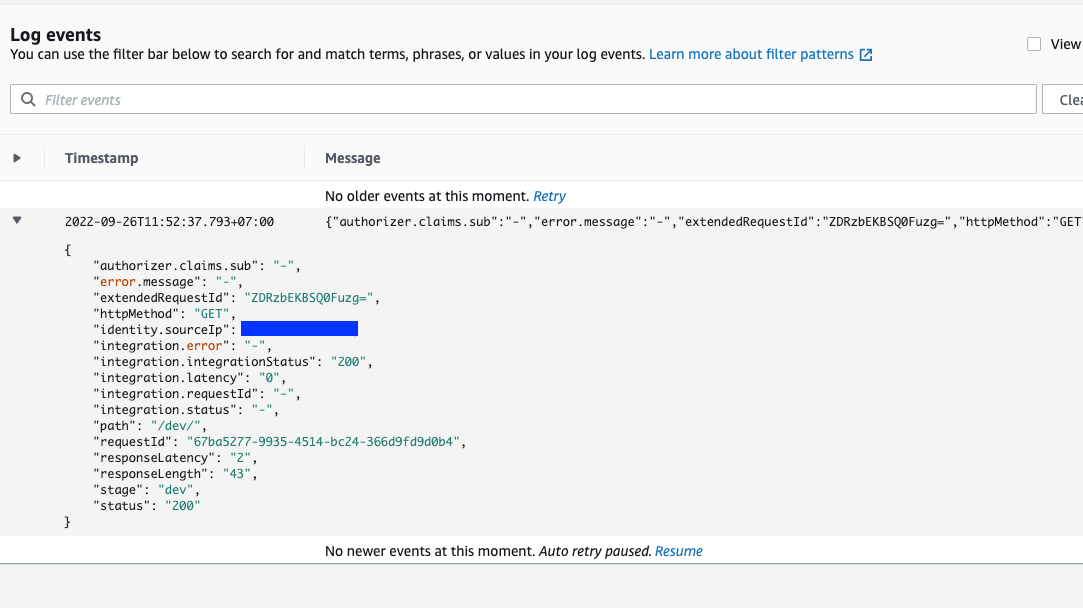
As noted above, access logs are a single log line that is logged out on each request that comes to API Gateway, and they’re often used for detecting errors or performing data analysis. This is in contrast to execution logs, which are a series of log lines that are logged out on each request that comes to API Gateway, and they’re often used for debugging. Here’s the execution log output for a single request I made to API Gateway
Note: When you deploy an API, API Gateway creates a log group and log streams under the log group. The log group is named following the API-Gateway-Execution-Logs\_{'{'}rest-api-id{'}'}/{'{'}stage_name{'}'} format.

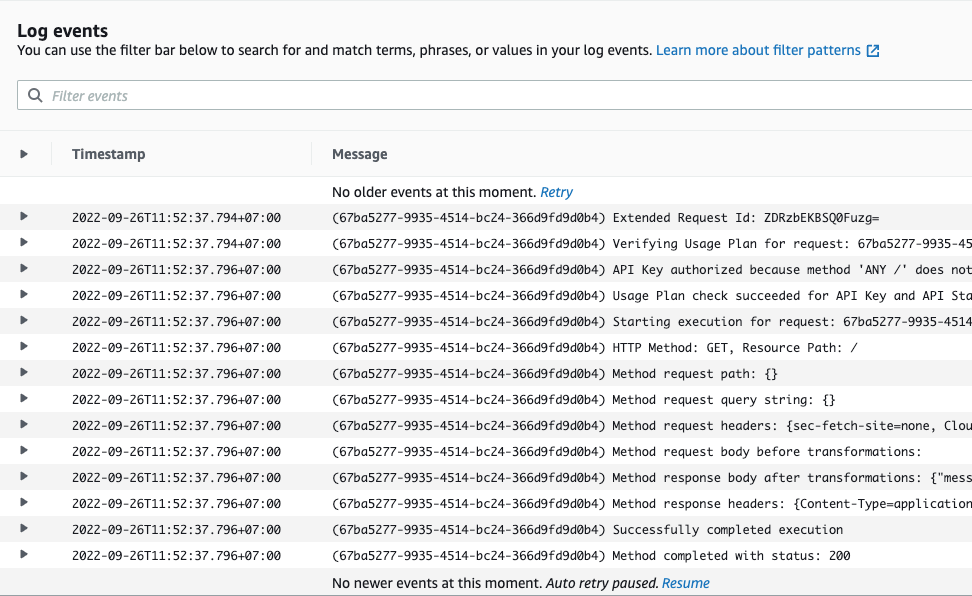
As you can see, there are a lot of log lines here. This is because execution logs are a series of log lines that are logged out on each request that comes to API Gateway.
In general, I disable API Gateway execution logs in the normal course of business. I only enable them when I need to debug an issue. I find that execution logs are too verbose for my needs. I prefer to use access logs for debugging and performance analysis.
How to enable access logs
To enable access logs, you will need to do the following:
- Create a CloudWatch log group
- Enable access logging in API Gateway and point it to the log group you created
- Define the format of the access logs(You can use the default format or define your own). This is optional.
In this section, I will walk you through each of these steps in AWS CDK snippets.
Create a CloudWatch log group
First, you will need to create a CloudWatch log group. You can do this using the LogGroup construct.
const logGroup = new LogGroup(this, 'LogGroup', {
  logGroupName: '/aws/apigateway/my-api',
  removalPolicy: RemovalPolicy.DESTROY,
})
Enable access logging in API Gateway and point it to the log group you created
Next, you will need to enable access logging in API Gateway and point it to the log group you created. You can do this using the AccessLogDestination and AccessLogFormat constructs.
const accessLogDestination = new apigateway.LogGroupLogDestination(logGroup)
Define the format of the access logs
You can define the format of the access logs using the AccessLogFormat construct. You can use the default format or define your own. Here’s an example of the default format:
const accessLogFormat = apigateway.AccessLogFormat.jsonWithStandardFields()

// Create an API Gateway REST API with access logging enabled
const api = new apigateway.RestApi(this, 'MyApi', {
  deployOptions: {
    accessLogDestination,
    accessLogFormat,
  },
})
That is it! You have now enabled access logging in API Gateway and pointed it to the log group you created. You can now start logging requests made to your API.
Source code for this example can be found here
Access log format
When configuring your access logs, you get to choose an output format for your access logs. In doing so, you’ll be constructing a string to be formatted by API Gateway. These strings can use values from the $context object that will be formatted based on the actual values of your specific request.
The API Gateway docs show four general formats that you can use for your access logs:
- Common Log Format (CLF). This is the default format.
$context.identity.sourceIp $context.identity.caller  \
$context.identity.user [$context.requestTime] \
"$context.httpMethod $context.resourcePath $context.protocol" \
$context.status $context.responseLength $context.requestId $context.extendedRequestId
- JSON format. You can use the JSON format to have a detailed string describing your requests.
{ "requestId":"$context.requestId", \
  "extendedRequestId":"$context.extendedRequestId", \
  "ip": "$context.identity.sourceIp", \
  "caller":"$context.identity.caller", \
  "user":"$context.identity.user", \
  "requestTime":"$context.requestTime", \
  "httpMethod":"$context.httpMethod", \
  "resourcePath":"$context.resourcePath", \
  "status":"$context.status", \
  "protocol":"$context.protocol", \
  "responseLength":"$context.responseLength" \
}
- XML format. You can use the XML format to have a detailed string describing your requests.
<request id="$context.requestId"> \
    <extendedRequestId>$context.extendedRequestId</extendedRequestId>
    <ip>$context.identity.sourceIp</ip> \
    <caller>$context.identity.caller</caller> \
    <user>$context.identity.user</user> \
    <requestTime>$context.requestTime</requestTime> \
    <httpMethod>$context.httpMethod</httpMethod> \
    <resourcePath>$context.resourcePath</resourcePath> \
    <status>$context.status</status> \
    <protocol>$context.protocol</protocol> \
    <responseLength>$context.responseLength</responseLength> \
</request>
- CSV (comma-separated values) format. You can use the CSV format to have a brief string describing your requests.
$context.identity.sourceIp,$context.identity.caller,\
$context.identity.user,$context.requestTime,$context.httpMethod,\
$context.resourcePath,$context.protocol,$context.status,\
$context.responseLength,$context.requestId,$context.extendedRequestId
I prefer to use the JSON format for my access logs. It gives me a detailed string describing my requests. I can then use this string to parse out the information I need. I can also use this string to send to other services like Elasticsearch or Splunk.
Access logging fields
There are a lot of fields that you can use in your access log format. Here are some of the most common fields that you can use:
$context.identity.sourceIp- The IP address of the client that sent the request.$context.identity.caller- The identity of the caller making the request. This is the identity that was used to call the API. If the caller is not authenticated, this value is null.$context.identity.user- The user name of the authenticated caller making the request. If the caller is not authenticated, this value is null.$context.requestTime- The time when API Gateway received the request from the client, in ISO 8601 format.$context.httpMethod- The HTTP method used. Valid values include: DELETE, GET, HEAD, OPTIONS, PATCH, POST, and PUT.$context.resourcePath- The resource path invoked by the request.authorizer.claims.sub- The subject of the JWT. This is the unique identifier of the user.integration.latency- The time between when API Gateway receives a request from a client and when it returns a response to the client. The latency includes the integration latency and other API Gateway overhead.integration.status- The HTTP status code that is returned by the integration back to API Gateway.
I recommend using the following fields for your access logs:
{
  "error.message": "$context.error.message", // The error message returned by API Gateway.
  "httpMethod": "$context.httpMethod", // The HTTP method used. Valid values include: DELETE, GET, HEAD, OPTIONS, PATCH, POST, and PUT.
  "identity.sourceIp": "$context.identity.sourceIp", // The IP address of the client that sent the request.
  "integration.error": "$context.integration.error", // The error message returned by the integration.
  "integration.integrationStatus": "$context.integration.integrationStatus", // The status code returned by the integration.
  "integration.latency": "$context.integration.latency", // The time between when API Gateway receives a request from a client and when it returns a response to the client. The latency includes the integration latency and other API Gateway overhead.
  "integration.requestId": "$context.integration.requestId", // The ID of the request sent to the integration.
  "integration.status": "$context.integration.status", // The HTTP status code that is returned by the integration back to API Gateway.
  "path": "$context.path", // The resource path invoked by the request.
  "requestId": "$context.requestId", // The ID of the API Gateway request.
  "responseLatency": "$context.responseLatency", // The time between when API Gateway receives a request from a client and when it returns a response to the client. The latency does not include the integration latency.
  "responseLength": "$context.responseLength", // The length of the API Gateway response in bytes.
  "stage": "$context.stage", // The name of the API Gateway stage that processes the request.
  "status": "$context.status" // The HTTP status code that is returned by API Gateway.
}
Access logging to CloudWatch
You can use the CloudWatch Logs service to store your access logs. You can then use the CloudWatch Logs service to search, monitor, and analyze your logs. You can also use the CloudWatch Logs service to send your logs to other services like Elasticsearch or Splunk.
In AWS console, navigate to the AWS cloudwatch service. Then click on the Logs tab. Click on the log groups tab. Open the log group that you want to use for your access logs.

Querying access logs with Log Insights
After you have enabled access logging for your API Gateway, you can query your access logs using Log Insights. Log Insights is a query language that you can use to search and analyze log data in CloudWatch Logs. You can use Log Insights to search for specific log events, filter log events, and aggregate log data. You can also use Log Insights to create dashboards and alerts.
Some of the most common Log Insights queries that you can use to query your access logs are:
Finding 5XX responses in CloudWatch Logs
fields @timestamp, @message
| filter @message like /"status":5/
| sort @timestamp desc
| limit 10
Finding aggregates with CloudWatch Logs Insights
Imagine you want to find the number of 5XX responses for each day. You can use the following query to find the number of 5XX responses for each day.
fields @timestamp, @message
| filter @message like /"status":5/
| stats count(*) by bin(1d)
Finding the most common 5XX responses
Imagine you want to find the most common 5XX responses. You can use the following query to find the most common 5XX responses.
fields @message
| filter @message like /"status":5/
| stats count(*) by @message
| sort count_* desc
| limit 10
Conclusion
In this article, you learned how to enable access logging for your API Gateway. You also learned how to query your access logs using Log Insights. I hope you found this article useful. If you have any questions or comments, please leave them below. Thanks for reading!
Source code for this example can be found here